


Facilitating communication and collaboration among groups and individuals managing EnviroDIY monitoring stations and conducting supplemental sampling and data collection in the Delaware River Basin.
Group Admins


Weekly Reports
- This topic has 163 replies, 17 voices, and was last updated 2:47 PM on 2021-06-11 by Carol Armstrong.
-
AuthorPosts
-
2019-05-28 at 3:12 PM #153655
Mike Bullard
ParticipantThanks Carol,
The battery voltage rapid drops have been present since Sept 2017. The drop and recovery is too fast to be the lithium battery actual voltage IMO.
David, you said these are artifacts?
Mike
Attachments:
2019-05-28 at 3:30 PM #153657 David BresslerParticipant
@bullard, @hicks can speak with more knowledge about this but your issue at SL113 and 114 is a bit different than those at SL133 (@rogers) and SL158 (@collins). But as I understand it, yes, your problem at SL113 and SL114 is an artifact – quick dips in battery voltage but otherwise more accurate representation of actual battery level. The problem at SL133 and SL158 is more substantial in that voltage reads very high (14v) and then zero – back and forth – and then levels at 4.03v…but none of these appears to be actual voltage of the battery. The only signal we have in this case that the battery is actually ok is that the sensor data look normal. This in in contrast to your case where the battery does have quick dips (artifact) but otherwise shows a more normal step-wise pattern in voltage. @hicks can probably give more precise information.
2019-05-28 at 5:03 PM #153658ParticipantOK. I see it on other stations also. Thanks.
2019-05-31 at 8:02 PM #153669Carol Armstrong
ParticipantThis is the report for 5/31/19
@lawler SL101-Musconetcong U – Were the sensors cleaned on 5/29? Both low and high turbidity are reading a constant 0 NTU for 52 hours as of this review. Depth readings appear unusual because of rapid changes in levels today, but it might reflect the intensity of intermittent rains on 5/29 and 5/30.
@blanton SL118-Wissahickon – Battery is slowly declining and recovers only to 3.5 v.
@ebel SL131 – Little Lehigh – No signals since 4/30. Could you provide an update?
@rogers SL133 – Upper Paulinskill – Last report was that the Mayfly logger has a problem and causing abnormal battery readings. Is there also a problem with the CTD sensor or are they related problems? Conductivity went to 169,260 uS/cm on 5/30/19, and depth declined abnormally during the same period. Turbidity readings appeared normal.
@collins SL158 – Primrose CK U-Solebury Sch – Are the problems with the logger also causing the abnormal water depth and conductivity signals here? Does the water temperature get to 22.7 degrees C (>72 degrees F)? The logger temperature of 39 degrees C (102 degrees F) today seems high and higher than other sites.
@wang SL176 – Schuylkill R – Fluctuations in DO% and DOppm from April 1 to 4, 2019 do not appear normal, e.g., DOppm went as high as 31.64 ppm. Fluctuations also appeared rapid in March. What caused this?
2019-06-05 at 9:57 AM #153682Kate Ebel
Participant@armstrong SL131 – I am aware of the problem and am working to fix it once the water levels go down (if ever). I believe the station is no longer receiving a strong enough signal from the card to transmit the data to the website. I retrieved the SIM card on May 21st to check things out, and all the data are being stored correctly, just not transmitted. We have been planning to move the station, but conditions have not yet been favorable – hopefully soon.
2019-06-06 at 7:05 PM #153686ParticipantThis is the report for 6/6/19
@Lawler SL101 and sl102, Musconetcong U and D: Turbidity transmissions have been at 0 NTU for the past several days – were the turbidity sensors removed from the stream?
@Bressler and @Hicks sl138 Lower Pickering at YMCA – Turbidity low and turbidity high signals are trending to increased differences in their readings. Usually the differences are small, but they are now persistently different by 3 NTU to 10+ NTU. What could cause this? This difference is significant in terms of indicating whether the sensors are fouled or not.
2019-06-06 at 7:32 PM #153688Shannon Hicks
ParticipantSL101 and SL102 had their turbidity sensors removed recently so they could be reused on two new stations (SL244 and SL245). Those new stations don’t have cellular coverage, which is why they’re not on the website.
SL138 has always had a slight mismatch between the low and high readings, but they have become more pronounced recently. It’s not much of an issue, because the LOW range reading should always be used when the value is less than 250 NTU. For any readings above 250, use the HIGH range signal. Looking at the historic graph shows that the two match up pretty close for values around 200 and above. But we’ll make a note of it and check it out next time we’re in the area.
SL138, along with a few other stations, have all started the odd negative spikes in voltage, usually in the morning when the sun hits the solar panel and starts charging the battery. It seems to be an issue with the solar charging circuit interfering with the battery voltage measuring circuit. They are “phantom reading” since many times they are well below the 3.3v needed to actually keep the Mayfly turned on, and recently a few stations have been around 14v. The easiest fix seems to be just turning off the Mayfly the next time someone makes a site visit. Swap out the memory card (because it’s good to do that anytime you visit a station), and then unplug the battery and solar panel from the Mayfly and wait a few seconds. Plug the panel and battery back in (make sure to put them back in the correct sockets!) and turn the logger back on. The battery readings should stabilize and read normally for many months now.
2019-06-07 at 5:28 PM #153690Francis Collins
ParticipantHello Everyone.
Concerning the battery display data anomaly on SL158 at Solebury School, restarting the station… switching it off/on seems to have reset the battery data display. Data display has been in the normal range for a few days now.
I hope that Kristine Rogers SL133 and Mike Bullard SL 113-114 get the same results.
Let me know.Another issue that occurred (after the sensors and stream gauge were taken out by the violent thunderstorms last week) was the depth readings from 240mm (normal baseline) to a “bogus” 2000mm??? What’s going on?
I had cleaned the sensor with the standard brush and didn’t realize until the next day that I had missed a “perfectly sized particular” particle in the sensor slot.
Once the “just right sized” particle was delicately removed with a goose feather the data reported in the normal range.
Next two issues… Concerning the Dreamsensor site.
1. Does viewing the legacy data ever crash/freeze your iPhone/iPad?
2. Has the legacy data for depth/conductivity show up blank?2019-06-09 at 7:42 PM #153691Chloe Wang
Participant@armstrong Regarding DO irregularities mentioned in 5/31 weekly report, I have no idea of the cause and had not noticed. Sorry I do not have insight, very mysterious!
2019-06-13 at 5:04 PM #153698Participant@collins, the data hosted on the drwisensors.dreamhosters.com website is all being forwarded to the new data portal at monitormywatershed.org, so I would suggest you use the new site for viewing your data. The Dreamhost website is something I threw together many years ago, even before the Mayfly project, and it wasn’t designed to handle extremely large datasets like we have now. One year of data from a Mayfly station contains over 100,000 rows of data. In order to graph the data in those cool interactive zooming displays on the Dreamhost site, your browser has to load all of the data into the browser and then graph it. So sometimes this causes issues if you’re viewing the page on a phone or a computer with minimal amount of memory or processing power or with a slow internet connection. Your site, SL158, only has 21,000 rows of data. Our first DRWI station was SL103 in May 2017, and it currently has 212,000 rows of data. My very first station from back in 2014 has over 500,000 rows. Even the best computer I have won’t display more than about 2 years of data, so I usually edit the page to make the historical graphs limited to showing only 18 months of data. But even then it will cause problems for certain computers and browsers.
Viewing the data on the new http://monitormywatershed.org/ page will let you see all of the historic data for a site and without stressing out your browser. You can also compare data between different sites and other interesting analysis options with the time series analyst tools. In the coming months we will be transitioning over all of the loggers to only use the new data portal and will be phasing out the Dreamhost website.
-
AuthorPosts
 Mike Bullard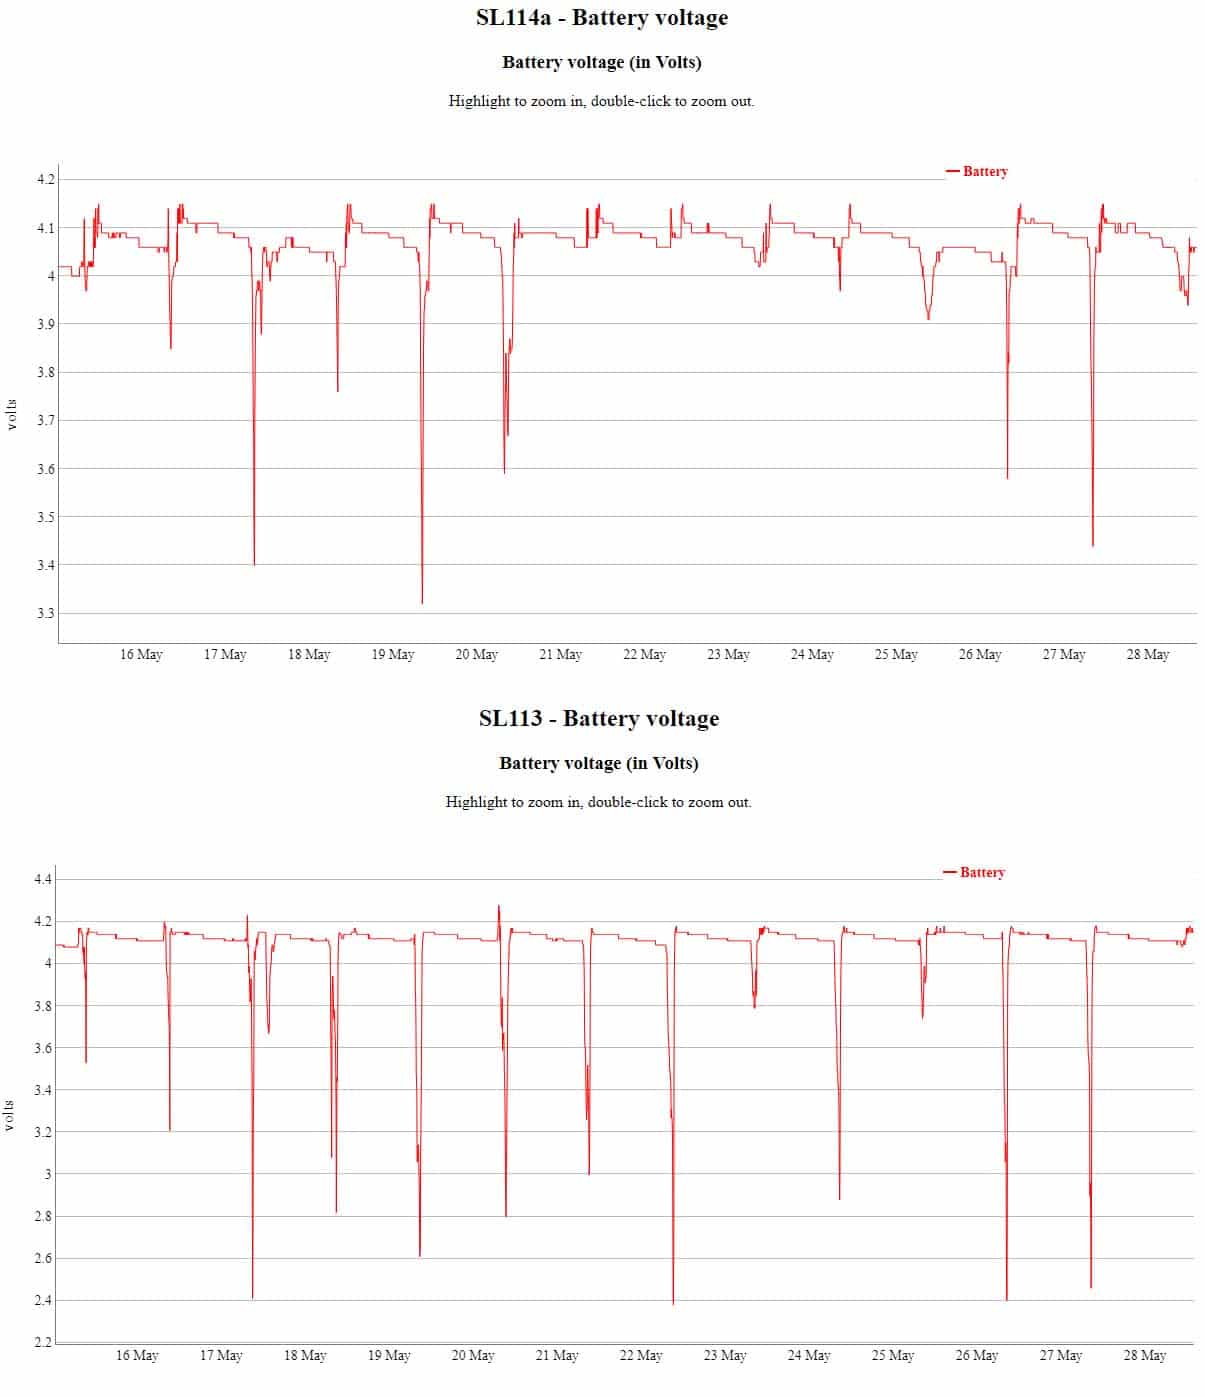
 Carol Armstrong
 Kate Ebel
 Shannon Hicks
 Francis Collins
 Chloe Wang
- You must be logged in to reply to this topic.
