Select an Area of Interest using the choices below to analyze the factors that impact water in your area and to begin to model different scenarios of human impacts.
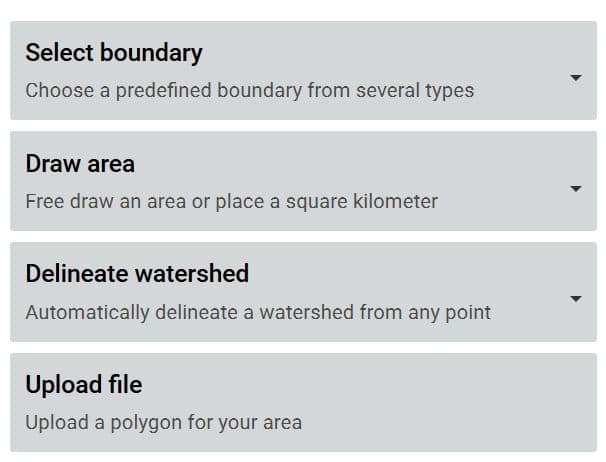
Select Boundary
You can select by political (county lines, congressional districts, and school districts) or major watershed (HUC 8-12) boundaries in the “Select boundary” tool. Once you have selected a boundary type, those borders will appear on the map, and the name of each region will appear as you hover over it.
Be aware of your zoom level when selecting by boundaries. If you are at too high a zoom level, you may not be able to see the boundaries on your map.
Draw Area
Free Draw: Free-draw an area of interest polygon by clicking on the map and repeatedly clicking at boundary corners. Close the polygon by double-clicking on the last point or by clicking on the first point.
Square Km: Draw a perfect square with one kilometer sides by clicking on the map where the square’s center will be.
Delineate Watershed
Continental US Medium Resolution: Click on the map to select the nearest downhill point along the medium-resolution flow lines of the National Hydrography Dataset. The watershed area upstream of this point is automatically delineated using the 30-meter resolution flow direction grid.
Delaware High Resolution: Click on the map to select the nearest downhill point on our Delaware River Basin high-resolution stream network. The watershed area upstream of this point is automatically delineated using the 10-meter resolution national elevation model.
Upload File
You can select or drag and drop a file to upload a polygon for your area. File must be a shapefile (zip containing shp and prj files) or geojson. Only the first feature is used.
