
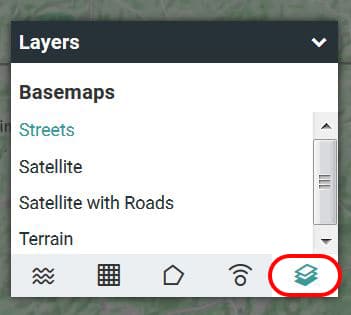
Just as Google Maps allows you to switch between road and satellite maps, there are several options for both the basemap and data overlays on top of the map. These are available in the Layers pane.
You can select a basemap image and several different types of overlays. The basemaps themselves come directly from ESRI or Google Maps and are not built into the application. If you have a very slow internet connection, the base maps may be slow to load.
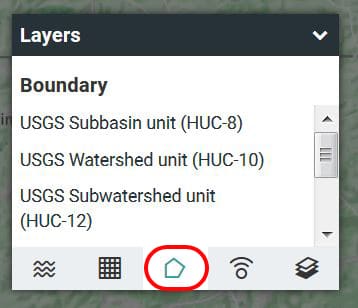
The overlays include boundary lines (like school districts and USGS hydrologic units) and color shading for land uses and soil types. There are also observation data overlays, which display locations and data from the USGS and other national river and weather monitoring stations. Please note that observation data is not available in all locations!
