As soon as you have selected an area to model, the application will change into geospatial analysis mode. The map will now show the area you selected in bright colors with the rest of the map grayed out. The Analyze pane will show the following information for your selected area:
- Stream network statistics
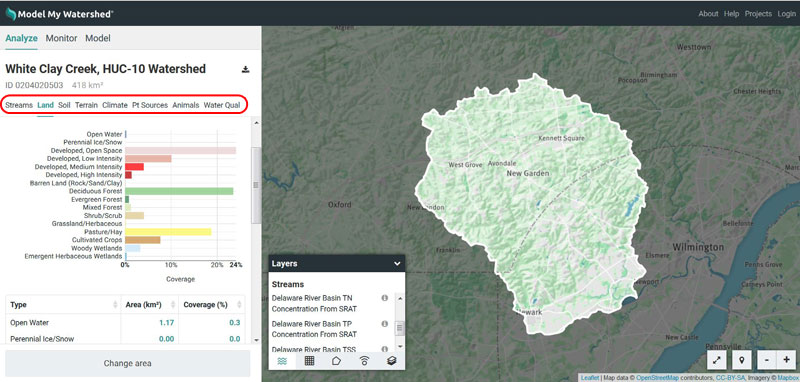
- Land cover distribution
- Hydrologic soil group distribution
- Terrain statistics
- Climate
- Point sources
- Estimated number of farm animals
- Water quality estimates (Delaware River Basin only)
These calculations and analysis are done on the fly for each area based on nationally available data. You will not get a pre-computed estimate or “canned” number. These are real values based on the most recently available national datasets. Because of this, the analysis may take a few seconds to complete and you may see a loading wheel as this happens. (It is generally very fast with a good internet connection.)
In the Analyze pane you can view the land use and soil type in both tabular and graphical form. (The table is below the graph. If you cannot see it, scroll down.) Use the tabs to switch between the different types of information.
You can sort the tabular data by type, area, or coverage percent. The bar graph coloring will match up with the colors assigned by the National Land Cover Database and can be used as a legend for the land cover and soil group overlays. The title at the top of the Analyze pane will list the name of the area (if selected by boundary) and the total size of the area. You can still change the map zoom and overlays in the map pane. Try turning on the NLCD overlay to compare the layout of land covers on the map to the percent of each land cover in the area.