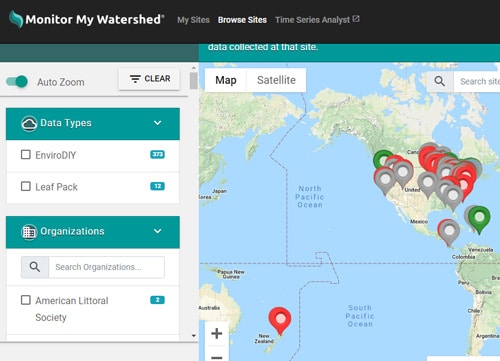
The Browse Sites page allows you to search all of sites streaming data to Monitor My Watershed. Users, regardless if they have an account, can access all information selected from every site in the data portal.
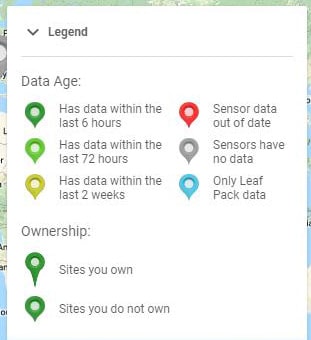
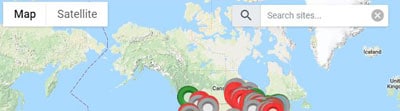
When the Browse Sites page is opened, you will see a map with markers indicating different sites around the world. The color and shape of the map markers indicate data age and ownership, as shown in the marker legend (Figure 4). The legend can be toggled open or closed (Figure 5).
5.1 Navigating to a Specific Site
There are several ways to view sites within the Browse Sites page. The first option is to use the filter bar on the left side of the screen. Another option is to use the search bar on the top of the site. The last method is to zoom in on the map and select a site based on a desired location.
Filter Bar
The filter bar on the left side of the screen (Figure 6) allows you to filter sites by data type, organization, and site type. Any and all combinations of information can be selected. After checking the appropriate boxes, the map will display the sites that fulfill the filters selected. You can then click on the site markers for sites you wish to examine further. Clicking the Clear button at the top of the filter bar will clear all filters.
Search Bar
Using the search bar works well if you know the name of a site you wish on the map. You can type the site name you are seeking into the search bar (Figure 7) and then click on the site marker that pops up on the map. You can then click on the site marker for the site you wish to examine further.
Zooming In
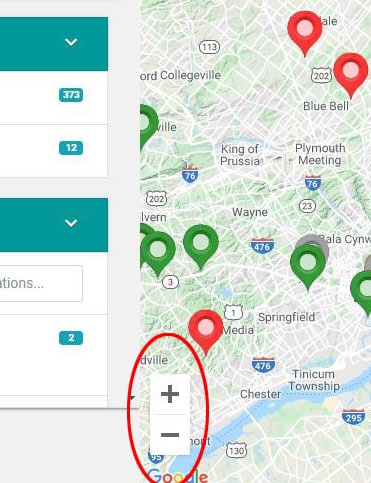
The last option available for navigating the Browse Sites page of Monitor My Watershed is to pick an area of the map and zoom in. This option may be best for users who know which area they are interested in, but do not know which organization has the information they require. Zooming in is done by clicking the plus and minus symbols at the bottom left corner of the map (Figure 8).
5.2 View Site Data
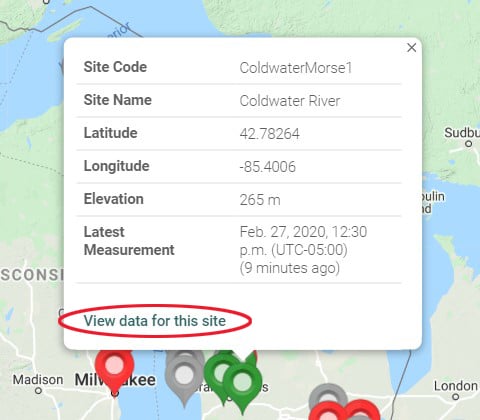
Once you have chosen a site you’re interested in, click on the site marker to open the pop-up site summary pane. You will see a summary of the site identification information and a View data for this site link (Figure 9). Click the link to be taken to the Site Details page.
5.2.1 Site Identification Information
At the top of the Site Details page you will see the site identification information (metadata) for the site. Depending on the information entered when the site was registered, the metadata can include some or all of the following information: name of the individual that registered the site; organization that deployed the sensor/site; registration date; sensor deployment date; site latitude, longitude, and elevation; other elevation datum; site type; stream name; major watershed; sub basin; the closest city/town to the site, and miscellaneous notes provided by the registrar of the site.
5.2.2 Sensor Observations
Scroll down on the Site Details (http://monitormywatershed.org/sites/xxx/) page, below the site metadata, to see sensor observation data for the site. Depending on the sensor deployed at the site, the data collected could have some or all of the following information:
- Depth of the water where the sensor was deployed (in millimeters).
- Temperature of the water the sensor is located in (in Celsius).
- Conductivity of the water in which the sensor is immersed (μS/cm).
- Temperature of the transmitting station box deployed near the sensor (in Celsius).
- Battery voltage of the measurement equipment.
- Signal strength of the sensor.
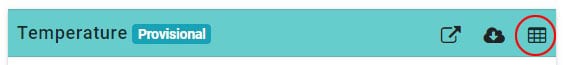
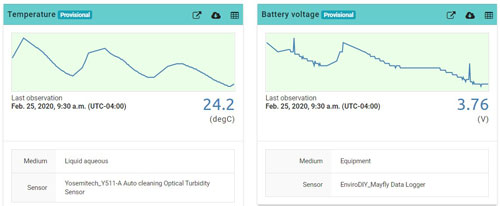
You will see graphs showing the last 72 hours of data collected from the sensor (Figure 10). Below the graph you will see the latest observation, the medium in which the sensor is located, and the full name of the sensor.
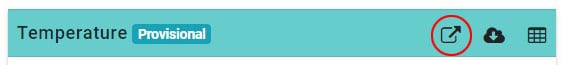
5.2.2.1 View in Time Series Visualization
The first data viewing option is to click the first icon in the graph header (Figure 11) to open Time Series Visualization. See Section 6 for detailed instructions on how to use the Time Series Visualization. Note: clicking this link will graph only this specific dataset in Time Series Visualization. If you want to graph all of the variables for the site, see the second option in Section 6.1.
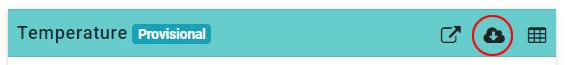
5.2.2.2 Download Data
Another data viewing option is to download the data. Click the second icon in the graph header (Figure 12) to download all the data for the selected variable as a CSV file. The file will contain all the data points collected and uploaded by the sensor from the time of its deployment to the current day. Depending on how long the sensor has been deployed, the download may take a long time.
5.2.2.3 View as Data Table
The last data viewing option is to open a data table. Click the third icon (Figure 13) and the raw data from the sensor from the last 72 hours will be displayed in a pop-up pane. The table contains the sample date and time in Coordinated Universal Time (UCT), the number of hours to adjust to accommodate the time zone, and the data point collected from the sensor.