
After registering your site, you’re ready to add sensor data to it.
Sending Data From a Data Logger
You can send sensor data from an Arduino data logger by following the detailed instructions in the EnviroDIY GitHub repository, Modular Sensors wiki.
REST POST Request Syntax
REST POST request syntax examples can be found in the documentation on the Monitor My Watershed GitHub repository.
Uploading CSV Sensor Data
Uploading EnviroDIY Monitoring Station Data – Filling Data Gaps for Real-Time Stations
For EnviroDIY monitoring stations that are programmed to transmit data to Monitor My Watershed (MonitorMW) you can upload data files (i.e., micro SD card files) by following the steps below.
Please note:
- Uploading continuous data is only necessary when real-time transmission of data to MonitorMW has stopped or is sporadic, i.e., to fill data gaps.
- Only station owners (or users with permission to use the owner’s login info) can upload data.
- For information on formatting and uploading files from stations not programmed for direct transmission or upload to MonitorMW, see “Uploading CSV Sensor Data Not Already Formatted for MonitorMW” below.
How to Fill Data Gaps
- Download the .csv file from the micro SD card to your computer.
- Log in to your MonitorMW account (contact David Bressler if you don’t know your username or password). Note that only station owners or users with owner login access can upload data.
- Click on “My Sites,” scroll down, and click on your site of interest to go to the site details page.
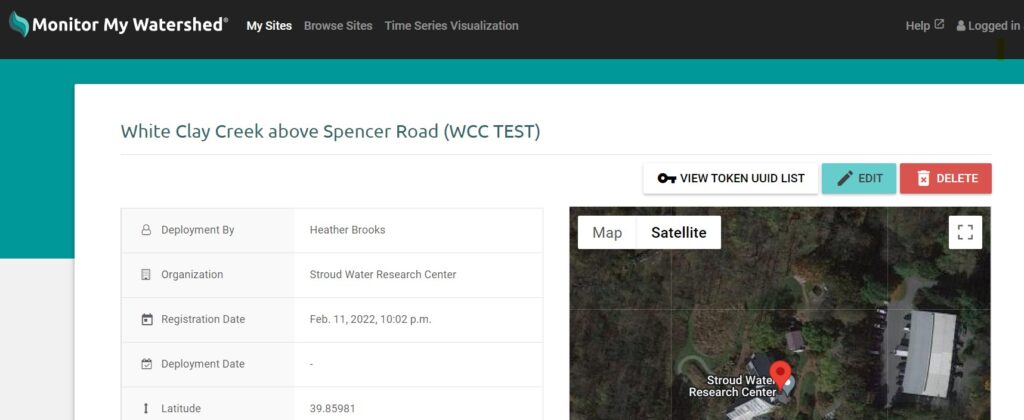
- Scroll down on the site details page and click on “Manage Sensors.”
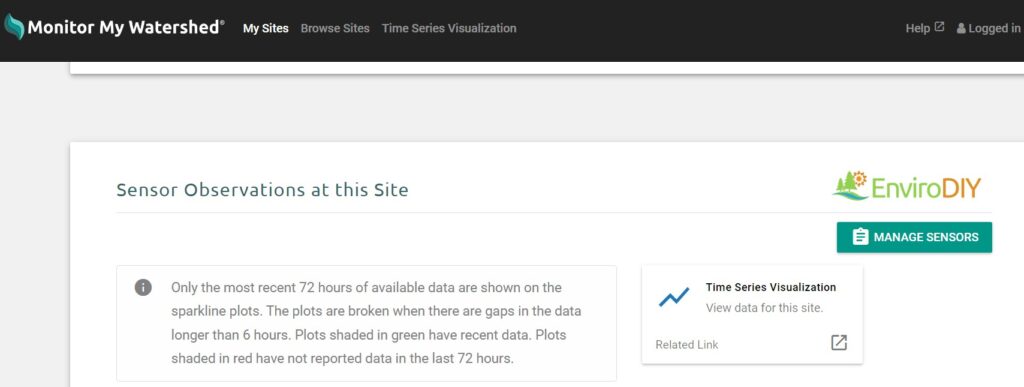
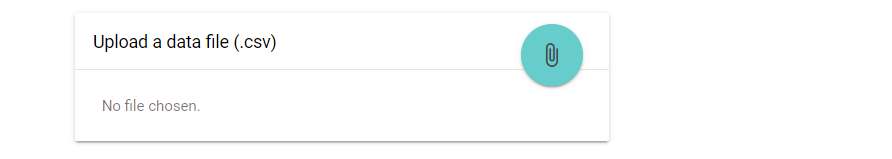
- Scroll to the bottom of the next page, click the paper clip under “Upload a data file (.csv),” and navigate to the file you’d like to upload.
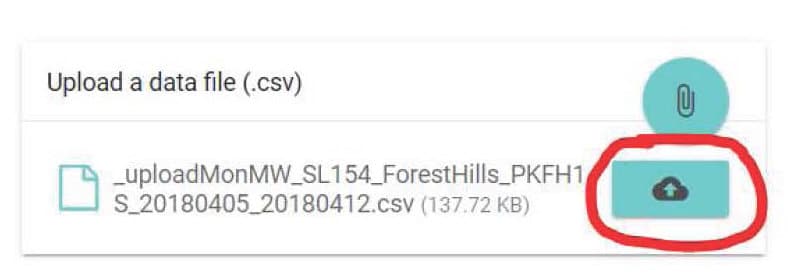
- Click the Upload button (see below) and wait (it might take a few minutes, and there is no spinning wheel to indicate progress).
- If the upload is successful, a pop-up window will appear for a few seconds, indicating a successful upload.
- If the upload is unsuccessful, it will run for several minutes and then a pop-up window will appear indicating the upload failed.
Uploading CSV Sensor Data Not Already Formatted for MonitorMW
- You must be logged in to MonitorMyWatershed.org and be the owner of the site in order to upload data. (Detailed instructions for registering a site on Monitor My Watershed are available in Section 4.1.)
- Make sure that you’ve registered all the variables for your site.
- Add sensors/variables as needed by selecting “Manage Sensors” in the Sensor Observations section of your site page and adding them with the “+” button.
- Note: many sensors can record multiple types of data or “variables” – e.g., conductivity and temperature. For those sensors, you must add every variable you’re measuring independently.
- Create a comma-delimited data file (CSV) with your sensor values and time stamps
- Only include data from a single site; do not mix data from multiple sites!
- The timestamp must be in the first column with data values in subsequent columns.
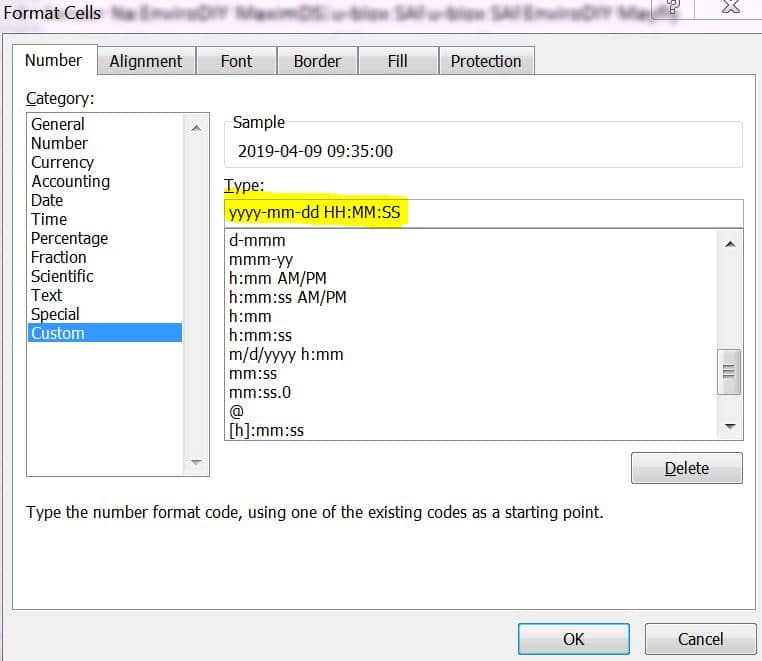
- The timestamp must be formatted as yyyy-mm-dd HH:MM:SS (e.g., 2019-07-31 11:15:00). If you are editing your file in Excel, you must manually select this date format. By default, Excel will format the timestamp incorrectly! To manually select the correct date format:
- Select the cells containing timestamp data.
- Right-click and select “Format Cells.”
- Make sure you are on the “Number” tab and that “Custom” is selected in the Category list.
- The “Type” field will show m/d/yyyy h:mm. DELETE that format completely and type in yyyy-mm-dd HH:MM:SS (Figure 20).
- Click OK to save the changes. Please note: the “Custom” time format is not persistent. If you open the file again with Excel, it will revert back to Excel’s default timestamp format, and you will have to change it to yyyy-mm-dd HH:MM:SS again. You may consider using a text editor like Notepad or Notepad++ for any subsequent file editing.
- All of your timestamps must be in the same time zone – that is, not corrected for daylight savings time. If your timestamps are in local time (with a daylight savings time adjustment), you must recalculate the times to be in a single time zone.
- Add the following header rows to the top of your CSV:
Sampling Feature UUID: [sampling feature UUID]
Date and Time in UTC [timezone] [yyyy-mm-dd HH:MM:SS]
Result UUID: [variable 1 UUID] [variable 2 UUID] [variable 3 UUID]…
[data][data][data] …- Replace [sampling feature UUID] with the sampling feature UUID shown at the bottom of the site information on your site page.
- A UUID is a Universally Unique Identifier (also called a GUID or Globally Unique Identifier). They are 36 characters long and are made of numbers 0-9 and the letters a-f, e.g.,12345678-abcd-1234-efgh-1234567890ab.
- Note: Clicking on the text of the Sampling Feature UUID on the page will copy it to your clipboard.
- Replace [timezone] with the correct UTC offset of your data. Eastern Standard Time would be UTC-5.
- Replace [variables 1 UUID] (and subsequent variables) with the UUID of those variables.
- The UUID for each variable is shown below the plot of recent data for that variable on the site page. You can also see the UUID of a variable at the top of the window when editing an already existing variable (but not when creating a new one).
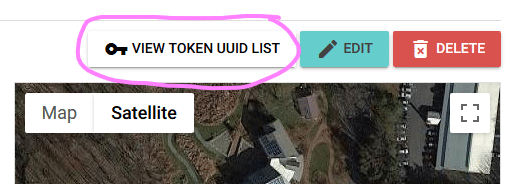
- Note: the UUIDs necessary to upload data to Monitor My Watershed will be visible under the plot for each variable or all together via the white button at the top of the page (Figure 21). You have to be logged in and the owner of the site in order to get these UUIDs. If you are not logged in or do not own the site, you will not be able to see any UUIDs or upload any data files. Each individual UUID can be quickly copied by hovering your mouse over the value and clicking on it. Note that the registration token is not needed to upload CSV files. That value is only needed to post live data.
- Add your data below the header.
- Replace [sampling feature UUID] with the sampling feature UUID shown at the bottom of the site information on your site page.
- Here is an example of a file ready for upload. Remember, if you view this CSV file in Excel, the timestamp will be automatically converted and will no longer be in the correct format!
- Upload the file to your site by selecting “Manage Sensors” in the Sensor Observations section of your site page and clicking on the paper clip button below the list of variables. Navigate to and select your file and then click “upload.”The maximum size for a single file at this time is only 1 MB. If your file is bigger than that, you will need to break it into multiple files.
- After you click the upload button, it may take some time for the file to be processed. A pop-up will appear at the bottom of the page and you will receive an email with the processing finishes.
- You should be able to see the uploaded data immediately after the processing finishes on both your site page and in Time Series Analyst.
