
Once you are happy with the area you selected, you can move on to modeling and modifying the area by clicking into the “Model” tab. There are two models available to simulate stormwater runoff and water quality, to create different conservation and development scenarios, and to compare human impacts of these scenarios.
- Site Storm Model: Simulates a hypothetical 24-hour storm by a hybrid of multiple algorithms; designed primarily for use with smaller, more developed areas.
- Watershed Multi-Year Model: Simulates 30 years of daily data by the MapShed model; designed primarily for larger, more rural areas.
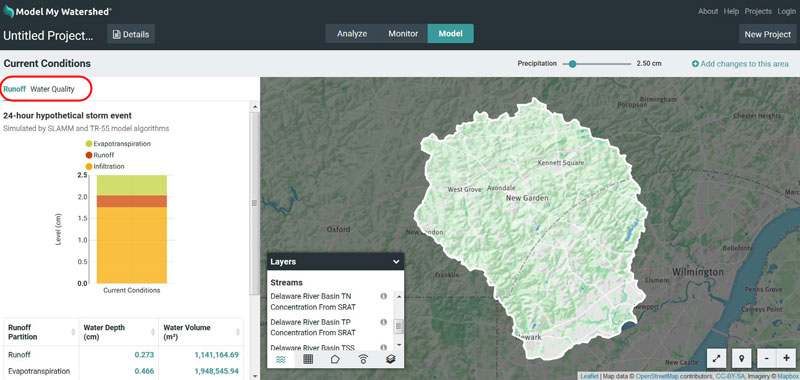
Choose one of the two models. On the next screen, you will see current conditions. The model output pane will now be filled out with predicted amounts of runoff and stream water quality. The runoff quantities are calculated using a combination of the TR-55 runoff model developed by the U.S. Department of Agriculture and the Small Storm Hydrology Model for Urban Areas developed by Robert Pitt for a single 24-hour rain storm. The water quality parameters are calculated using the EPA’s STEP-L water quality model. For more information on the specifics of these calculations, see the Model My Watershed technical documentation.
The runoff tab in the model output pane shows the partitioning of the rainwater into runoff, infiltration, and evapotranspiration as a stacked bar graph. In the water quality tab, you will see both tabular and graphical data showing predicted water quality for any streams in the selected area. Because the model is running with real data on your custom area, it may take some time for the model to run and you may see a loading icon. (It is generally very fast with a good internet connection.)
When you begin modeling, you will always begin in the “Current Conditions” tab. In this tab, you see the analysis and resulting model of the land exactly as it is. The only thing that can be changed in the “Current Conditions” tab is the quantity of rainfall to model.
Typically, a user will focus on modeling a quantity of rainfall that corresponds with an annual exceedance probability. For example, a user may be interested in modeling the 24 hour precipitation that has a 50% probability of occurring in any given year (meaning that the amount of precipitation recurs only every 2 years) or a 2% probability of occurring in any given year (the amount of precipitation recurs only every 50 years). Sometimes these precipitation exceedance probabilities are referred to as the “2 year storm” or the “50 year storm”, respectively. For guidance on selecting the quantity of rainfall, particularly for locations in eastern PA, DE, NJ, and NY, see Ensign, S. (2020) Precipitation Recurrence Intervals for Model My Watershed’s Site Storm Model, HydroShare.
9.1 Create a New Scenario
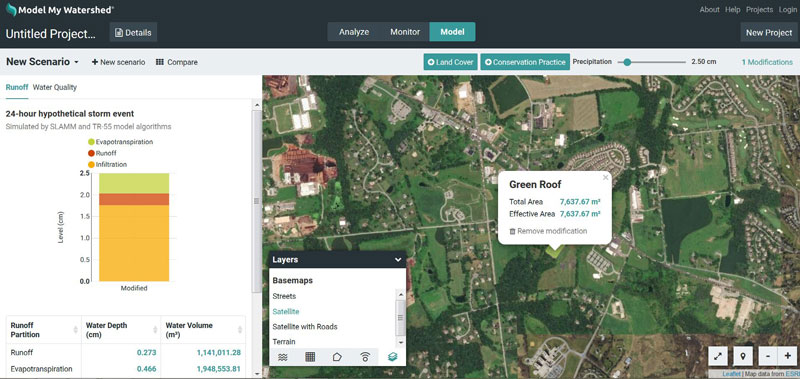
To begin making changes to the landscape, click on the “Add changes to this area” link at the top of the screen. To start, this looks exactly like the “Current Conditions” tab but with two new buttons, one for land cover and another for conservation practices. Each of these is a freehand drawing tool to modify the current land use.
Select the Land Cover or Conservation Practice button, choose a new land use or conservation practice, and then click points on the map to draw an area over which to apply it. As soon as you add a new land use or conservation practice, the model will re-run in the background to calculate what has changed and all of the plots will be updated. You will see loading icons again in the model pane as this happens.
See the Model My Watershed technical documentation for an explanation of how the runoff and water-quality contributions of conservation practices are calculated.
9.2 Add Modifications
As you add modifications, you can see details about amount of area modified by clicking on any modification box. You can also see a list of all of the modifications you made in the scenario by clicking on the space in the upper right of the map pane where it says “x modifications.” This gives a sort of “shopping cart” of modifications grouped by the type of modification.
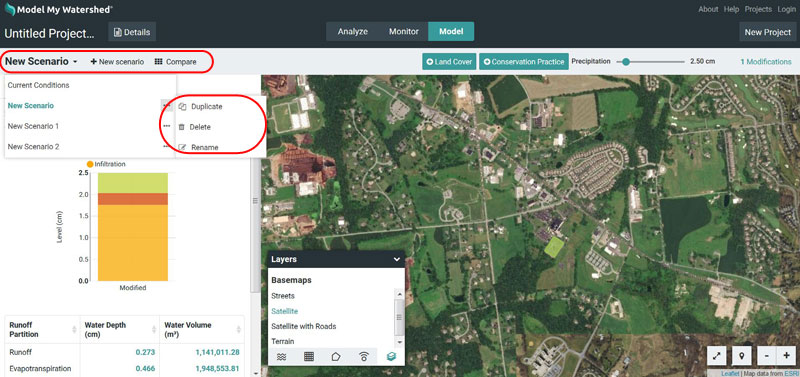
You can delete any modification by clicking the trash can next to it. If it helps to decide where to make changes, you can still use the small globe icon to select which overlays to display on the map.
You can create many possible scenarios of landscape modification by clicking on “+ New scenario” above the model output pane. Scenarios can be renamed, duplicated, and deleted, and if you are logged in, shared through the same menu. To help sort through many scenarios, click on the arrow next to the scenario name below “Untitled Project.”
9.3 Compare Scenarios
Once you have created several scenarios, you can compare all of them by clicking on “Compare” (above the model output pane) to show the original results from the “Current Conditions” tab and the modified results as you change the landscape.
The “Compare” option doesn’t appear until you have defined a New Scenario in your project, by selecting the “Add changes to this area” button in the upper right-hand side of the panel.
The compare window should now look similar to this:
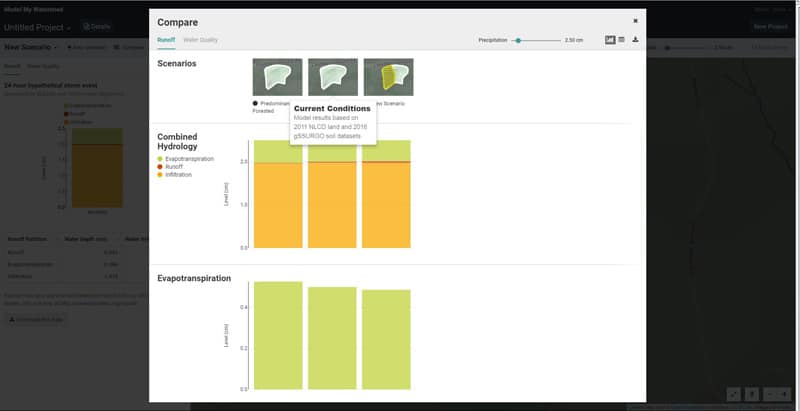
Clicking “Compare” gives a side-by-side comparison of all of the modified scenarios along with the original conditions before any modifications.
The screen shots above show a side-by-side comparison of all of the scenarios along with the original conditions before any modifications. It also shows what the partitioning would be if the landscape were 100% forested. This 100% forested condition will give the maximum amount of infiltration for the landscape, given its soils.
