
Facilitating communication and collaboration among groups and individuals managing EnviroDIY monitoring stations and conducting supplemental sampling and data collection in the Delaware River Basin.
Group Admins
Data Analysis and Usage
- This topic has 7 replies, 5 voices, and was last updated 10:45 AM on 2019-11-14 by Matt Gisondi.
-
AuthorPosts
-
2017-08-14 at 8:33 AM #153132
 David BresslerParticipant
Purpose: Analyzing and sharing data related to answering specific questions.
2017-08-18 at 2:38 PM #74284 Shane MorganParticipant
To view the data from the mayfly loggers in White Clay Watershed, manned by the White Clay Wild and Scenic Program please use this link. Contact Shane Morgan if you need any other information.
To see the Data Template Format we used to import into R-software Program (look at header row): https://www.dropbox.com/sh/o8u1x3kikwv5uiw/AABLHR5QtxgOv2uAl9whYycta?dl=0
2017-09-01 at 10:02 AM #74292David BresslerParticipantData from Mayfly loggers in White Clay Watershed (Broad Run and Eqypt Run): https://www.dropbox.com/sh/2bns55kwhk08j6m/AACdrsMP4Thp2ZrTyj5Oh-XYa?dl=0
2019-01-02 at 9:45 AM #153163 Matt GisondiParticipant
Hello everyone, I noticed a few people downloaded the “Sensor Station Site Summary” template and example that I posted back in late September. I was wondering, from those of you who have worked with these documents, how helpful/useful they are for you and your goals with the sensor station? Has the exercise of working through this document using Model My Watershed and other data sources been effective in better understanding the watershed above your station? Have there been any issues or points of confusion with the documents? Are the provided directions clear?
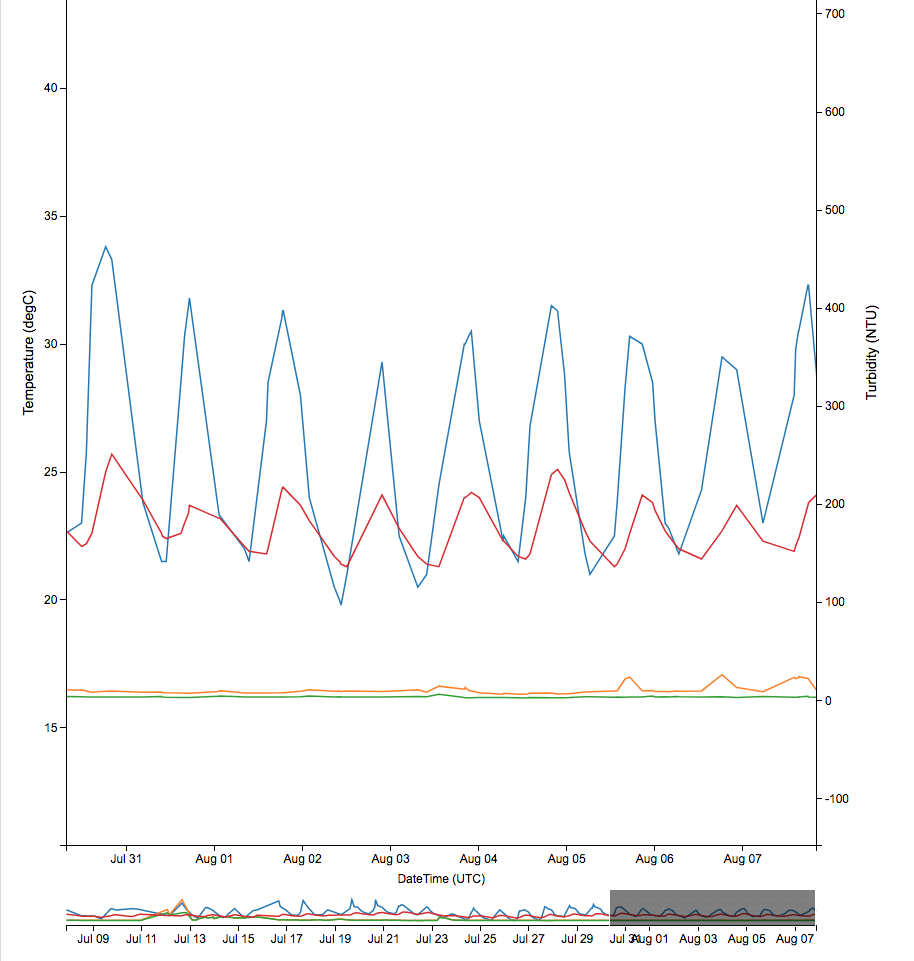
2019-08-07 at 6:38 PM #153769Carol Armstrong
ParticipantAt SL138 (Phoenixville YMCA), since Aug. 5 the turbidity-high readings have taken a separate course from low turbidity, as can be seen in the attached graph. Looking at turbidity-high and -low, and temperature of the logger and water, the turbidity-high appears to have some correlation with logger temperatures. Of course, the correlation is badly marred by the infrequent signals. Is there anything that might explain the strange turbidity-high readings being so divergent from turbidity-low?
Attachments:
2019-10-14 at 7:42 PM #153862Participant@bressler, @hicks, @johnson, @gisondi, @blanton, @diblasio, @ebel, @melvin, @ruggiero, @anderson, @eiannelli, @gosse, @moore, @kalusky, @lmoore, @archer, @lawler, @shanemorgan, @krogers, @ferrell, @fenchel, @toran, @weinberg, @wilson, @griffith, @seeds, @yake.
I’m sharing an observation about using discharge curves to estimate sediment or chloride loads on a stream, and would like to hear the thoughts of others about the topic of analyzing sediment and other loads using the discharge equation.
This applies to datasets in which discharge ratings were made (with grab samples) when a storm event caused the stream to flood its banks. The problem is that the discharge curve equation produces incorrect volume/velocity estimates – and thus incorrect load estimates if the storm that is analyzed resulted in the stream flooding the banks. If the discharge curve is based on the cross section measurements of the stream, then when the stream breaches its banks, the volume/velocity (m3/sec) does not apply and will overestimate the sediment load and other loads. Corrections, clarifications, and confirmations would be appreciated.
2019-10-15 at 7:49 AM #153863Dave Yake
ParticipantCarol, excellent questions and observation re flooding and discharge sediment loading. I have a couple of suggestions.
1. The total sediment load of a RunOff event is very highly correlated (linear slope) w/ the RunOff Intensity * Surface RunOff . Where RunOff Intensity is roughly the Slope of the rising part of the RunOff Hydrograph Curve… the slope can usually be estimated from the near peak flow (even though in the case of flooding the peak flow is lower than expected due to flooding of the banks… ie.. lower flow and under predicted total flow) using the following equation:
RunOff Intensity = (“Fl0w@near peak” – “Flow@start of runoff”)/(Time@ near peak – Time@ start of runoff)
Surface RunOff estimating is difficult because of the flooding…. So, in this case one must use a separate mode such as the “WHAT” CN RunOff Model to estimate total surface RunOff using Rainfall and soil moisture input. I can provide that model to you if you are interested. Very straight forward to use. In this case, one would input into the model 2 variables, rainfall during that event and soil moisture prior to the rain.
2. I suggest that you look back at 2-4 prior rain events of varying size…eg..0.5 , 1.0, 1.5 inches….and do a integration of the hydrographic using the discharge curve (which would be accurate since it would be less than flood stage) to obtain the estimated total sediment for the rain event… ie… each time element of the hydrograph would be the following:
TSS * Flow *time increment = sediment for that time element.
add up all the time elements and you get the sediment for the rain event.
3. Once you have completed these 2-4 rain event total sediment calculations, then you can estimate the RunOff Intensity and the Surface RunOff and plot sediment vs. RunOff Intensity * Surface RunOff. This plot generally has a pretty high RSQ straight line slope. Using this graph/equation you can estimate the total sediment load for the flooding rain event by going to RunOff Intensity* Surface RunOff location on the graph and calculating the sediment from the straight line.
If you are interested in adopting this technique, let me know and I can prepare a template for you..
Regards… Dave
2019-11-14 at 10:45 AM #154019Matt GisondiParticipantHi Carol,
To piggyback off of Dave Yake’s response, the Cit Sci group at Stroud, specifically myself and Dave Bressler, are currently working with Dave Yake on testing and writing out the process to using this RO Model. It’s a promising option to fill-in the blanks when in-stream discharge measuring has not or cannot.
Keep your eyes and ears out on this topic Carol since we’re going to be working on this for the next couple of months. We’ll be doing an official test of the model versus in-stream measuring on-site at Stroud’s HQ.
For now, I would say to analyze storms that stay within bank to get an idea of the sediment loads and chloride loads in those conditions. Then I would compare those results derived from the Load Calculator and compare them to Dave Yake’s RO Model before finally doing some analysis for storms out-of-bank with his model. This could be helpful for Stroud’s purpose of further testing the model.
Matt Gisondi
-
AuthorPosts
- You must be logged in to reply to this topic.
